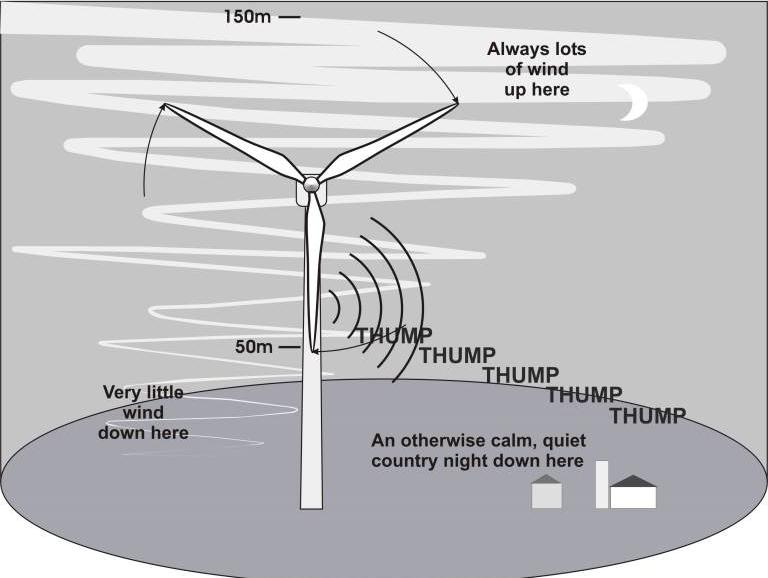
Turbulent inflow noise is predominantly a low frequency phenomenon dependent upon the atmospheric length scales and turbulent intensity levels in an acoustic spectrum. The magnitudes of inflow noise mechanism dominate in overall sound pressure level produced from turbine. The rotational noise is governed by blade tip speed and rotor diameter. With increase in Mach number and rotor RPM, the sound pressure levels are found to increase. The blade pitch has pronounced effect on sound pressure levels and power production from turbine. The observer azimuth angle is key factor in sound pressure level perceived by receiver and found maximum in downwind and upwind directions at high frequencies. The “swish” amplitudes from blade vary with observer position and found higher in upwind than in downwind direction. The amplitude modulation of wind turbine noise is perceived clearly in the near field compared to far field. The velocity deficit caused due to tower wake affect the power produced from turbine and generate the impulse noise at blade passing frequency of turbine. The blade and tower wake interactions are complex in nature and noise produced due to them can be eliminated in upwind turbine configurations by trimming the pitch and yaw of the turbine blades. Trailing edge noise from blade airfoils are found to be dominant at high frequencies only and magnitude of sound pressure levels depend on the angle of attack definitions. The source and receiver-observer positions are essential to evaluate the sound pressure levels at different perceived observer positions. Sound waves are assumed to propagate in atmosphere like optic rays and are influenced by atmospheric conditions such as temperature, humidity, wind velocity and direction, and also in areas where hill terrain and/or bluffs could be a factor that can create wind-shear, which at times can be unpredictable and loud, whereby producing an invasion of disruptive noise upon the receiver.
The Frequency spectra, Sound Pressure Level (SPL) and Decibel (dB) is a measure of the pressure at the receiver’s location and at levels for different observer azimuth angles which indicate that at 90° in a cross wind direction, the sound pressure level is lower compared to 0°/180° at downwind/upwind directions. Sound pressure is dependent on the variables of the acoustic environment.
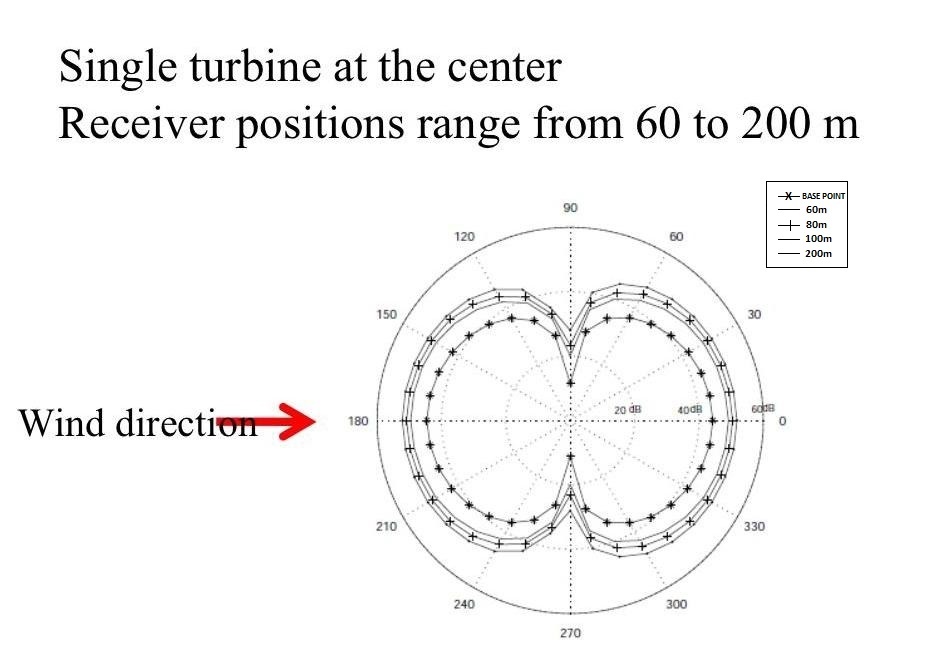
Sound Directivity: It is known that sound pressure level changes with the observer positions and levels for sound directivity. For a single wind turbine case, as depicted above, the receiver moves around the circular from a base-line point with the radius range from 60m to 200m. The wind turbine is located at the center of the circulars and the wind blows from 180° to 0°. We can conclude that the noise radiation from a wind turbine behaves like a dipole sound source. Since the blades are twisted, there are also nonsymmetrical properties. Therefore, there is no doubt that the best location for the residents is in tangential direction of the rotor plane.
Noise emitted from wind turbines is composed of aerodynamic and mechanical sound and has directional radiation characteristics. In order to investigate the horizontal sound directivity at the ground level under various wind conditions, field measurements are performed over long periods. The distinguishable sound directivity is revealed by onsite A-weighted downwind noise measurement testing, in order to be free of upwind interactions with the turbine. The mean A-weighted SPL in the crosswind direction are usually 4–5 dB lower than those in the up-and downwind directions. This tendency is similar to the results at other wind turbine sites. An empirical formula for the average directivity correction is proposed to estimate the apparent A-weighted SPL by using measured sound levels in any direction relative to the wind turbine, and the reliability of the formula confirmed. Furthermore, obtaining associated wind turbine operational data such as the rotor rotational speed, output power, and direction is also recommended to assess the acoustic characteristics of wind turbine noise more accurately.
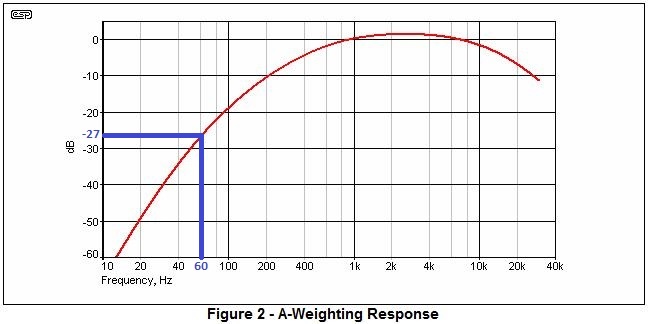
A-weighting Measurement: To obtain any correlation with reality, the noise to be measured is to be of very low amplitude 40-50dB unweighted, has a broad frequency spectrum without appreciable harmonics, and free from impulse, tonality, or rhythm.
A-weighting filters are designed to provide a highly optimistic measurement that rarely correlates with perception or annoyance, and are not a true representation of human hearing, despite claims, standards and legislation to the contrary.
The SPL range between 'just audible' and 'seriously loud'. is based at 1kHz, this ranges from 0dB up to 100dB, which is quite loud. A 100dB range means that the loudest sound is over 100,000 times louder than the 'just audible' sound ... but that's at 1kHz. However, at 31.5Hz, the range is far less. The difference between a sound being just audible and very loud is only about 35dB. At a frequency of 31.5Hz, the loud sound (100dB SPL) is only 56 times greater than the point where it becomes audible.
This means that a comparatively small SPL difference can take a signal from below audibility to extremely annoying.
Below shows a comparison between the mean power output in a variable wind compared with the steady wind power curve. The influence of the unsteady component of the wind on the mean power output is rather typical of most turbines in that at mean speeds below around 8 metres/second, the mean power output is greater than the steady power output values. This is due to the weighting from the upper end of the speed variations on the steep part of the power curve. Above this speed, the situation reverses because the high speed components of the wind speed are now reaching the flat part of the power curve and may even reach as far as the cut-out part of the power curve.
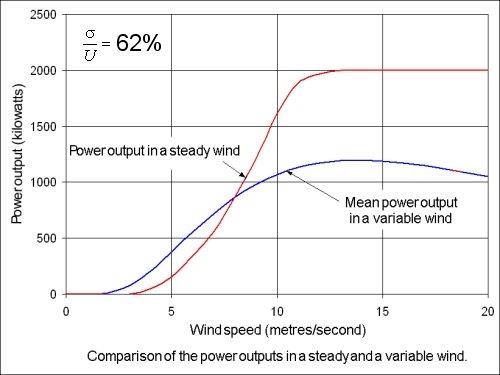
It should be noted that there is never a practical circumstance where the mean power output reaches anything like the rated power output. The ratio of the mean power produced at a particular mean speed to the so-called rated power output is called the capacity factor. This is itself a function of mean wind speed and so has no more significance than the mean power outputs themselves. As can be seen from the results above, it ranges from about 0.2 at a mean wind speed of 5 metres/second to about 0.5 at 10 metres/second.
OBSERVATIONS: 1 YEAR OF IN HOME TURBINE NOISE OBSERVATIONS 2017 @ RECEPTOR 35.3 Port Ryerse
Communities are looking for solutions & compromise to the invasion of audible wind turbine noise in their lives.
REFERENCES:
Turbulent Inflow Noise Prediction from Wind Turbine Blades
Horizontal directivity of sound emitted from wind turbines
Siemens SWT-3.0-113 (T1) Rotational speeds 6.0 – 15.5rpm
60sec/6sec = 10rpm = LOUD-DISRUPTIVE-NOISE! - During Light to Moderate South-Westerly Winds
60sec/8sec = 7.5rpm = QUIET - During Most Light to Moderate Wind Conditions